
But your question posed an interesting challenge: How close could I get to duplicating the information contained in the text summary with the new customization tools in PortfolioCenter 5.8? Here are my results.
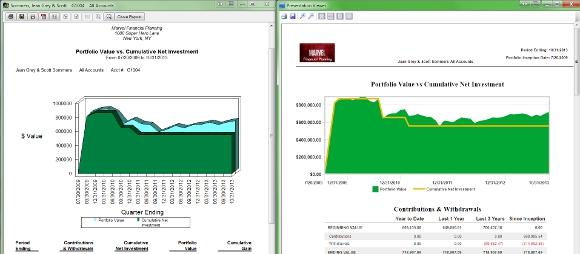
The traditional PV vs CNI with the text summary looks like this:
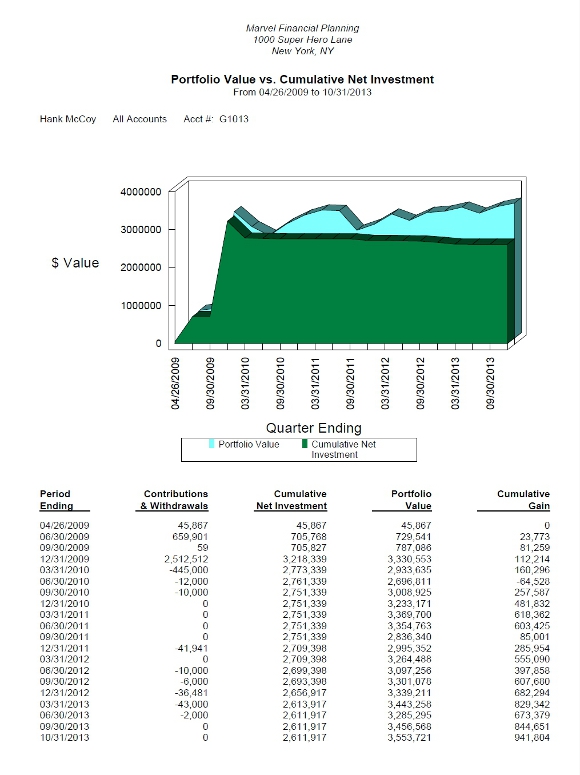
Traditional Portfolio Value vs Cumulative Net Investment
While no option contains the Cumulative Net Investment number, you can capture the total contributions and withdrawals. Here’s my “replacement”:
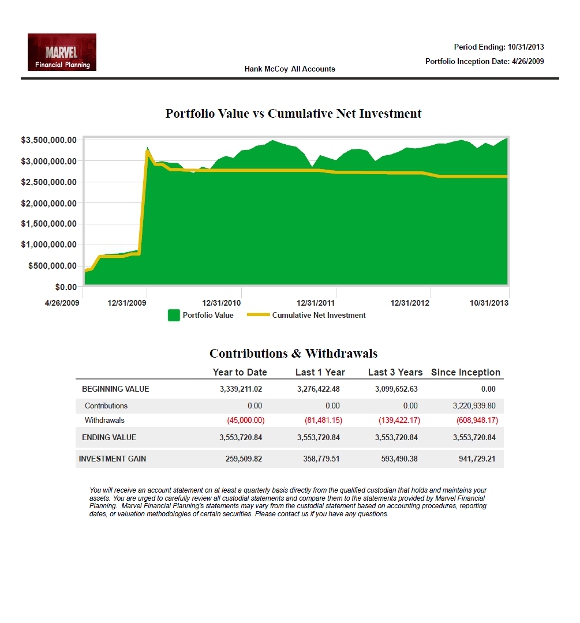
Krisan’s Replacement
I also added a “legalize” footer about comparing PortfolioCenter reports with brokerage statements. Many managers of my managers have been adding this kind of disclaimer to reports which contain ending market value as a result of SEC audits in the post-Madoff world.
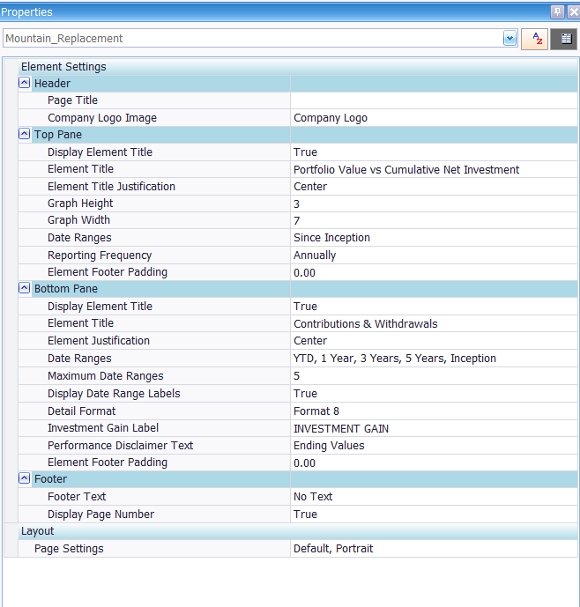
To create this report use the following:
Base Page: Two Pane Stacked Layout
Layout: Portrait
Top Element: Portfolio Value vs Cumulative Net Investment
Bottom Element: Components of Change
Theme: Clean
Note: Use Format 8 in the bottom element.
For more date ranges in the bottom element, turn the page to Landscape and change the graph width to 10.
Change the settings as follows: